
Celebrating Future Museum Leaders
Jul. 25, 2024
By Emmanuel Beatty
On National Intern Day, Emmanuel Beatty interviews seven of his peers, exploring their diverse department responsibilities as part of the Penn Museum’s paid summer internship program.
Read More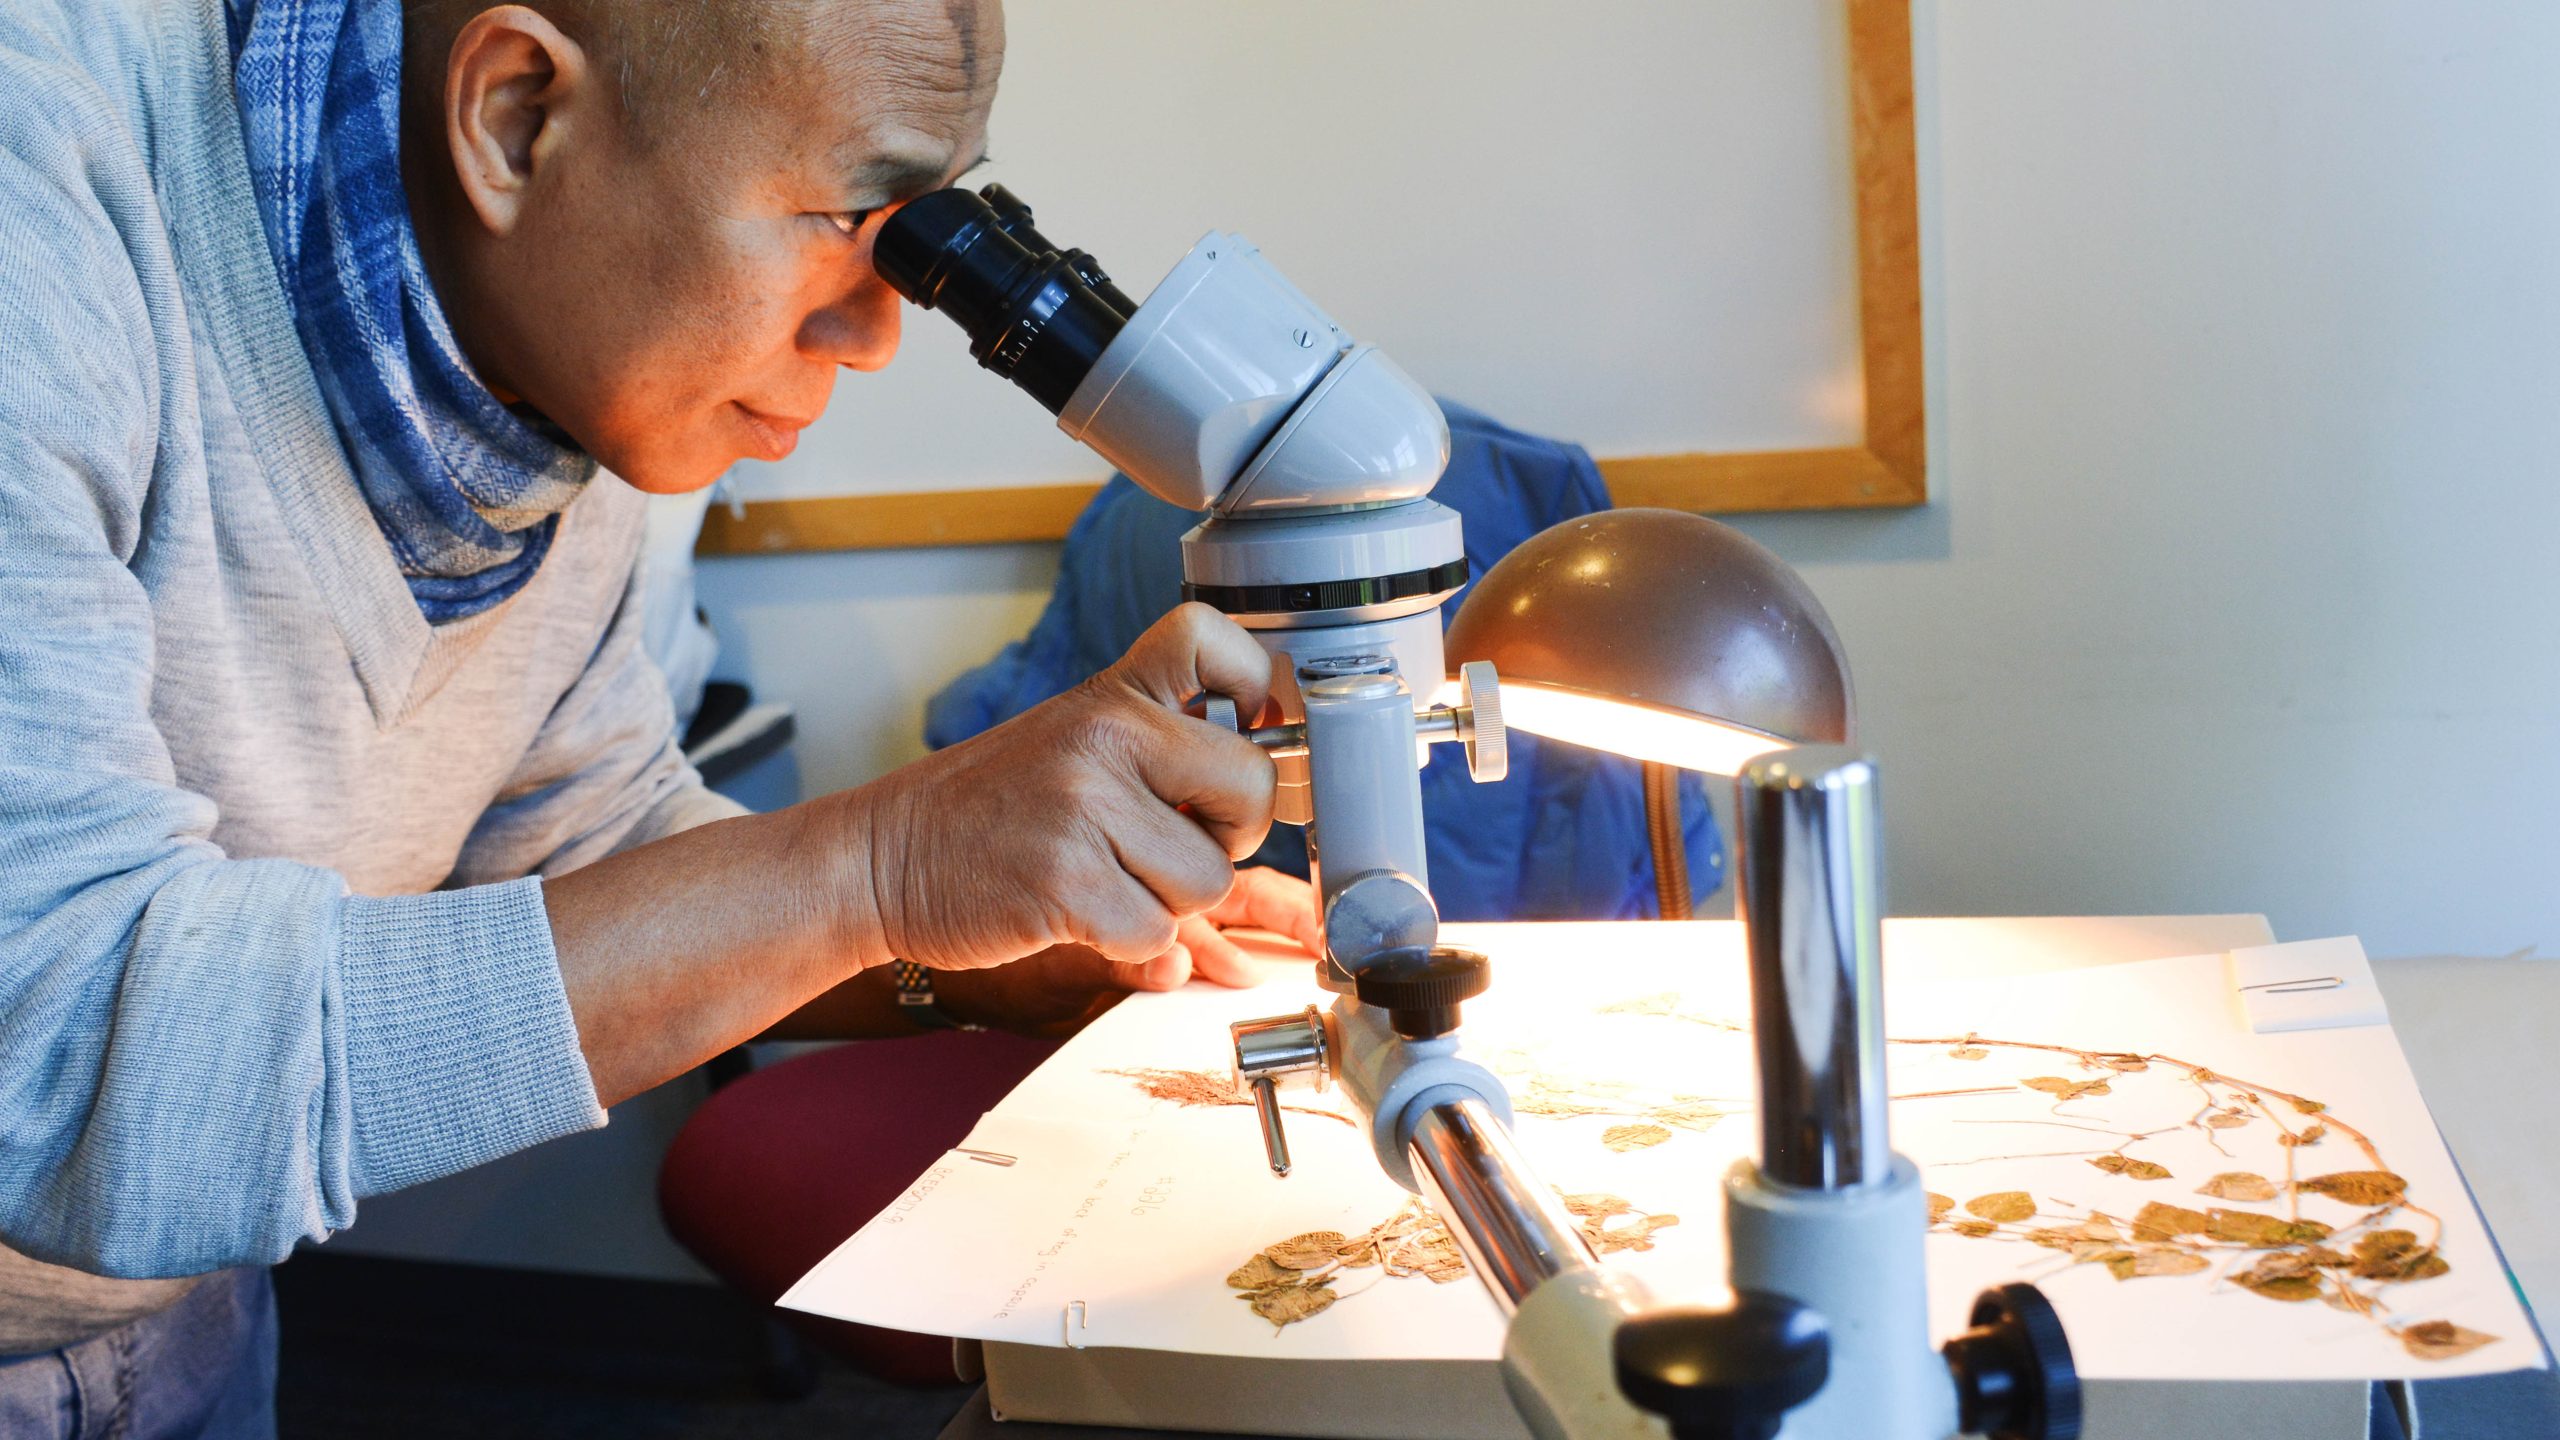
Jul. 16, 2024
By Joyce White
The Science of Seeds
Joyce White, director of an archaeological project studying a UNESCO World Heritage Site in Thailand, reveals the scientific methods archaeobotanists use to unlock the secrets contained within plant remains excavated from archaeological sites.
Jun. 27, 2024
By Corinne Muller
Safeguarding Culture in Conflict
As museums and monuments in Ukraine have been destroyed during war, Corinne Muller of the Penn Cultural Heritage Center reflects on recent collaborations around the world to preserve cultural heritage.
Jun. 12, 2024
By Qi Liu
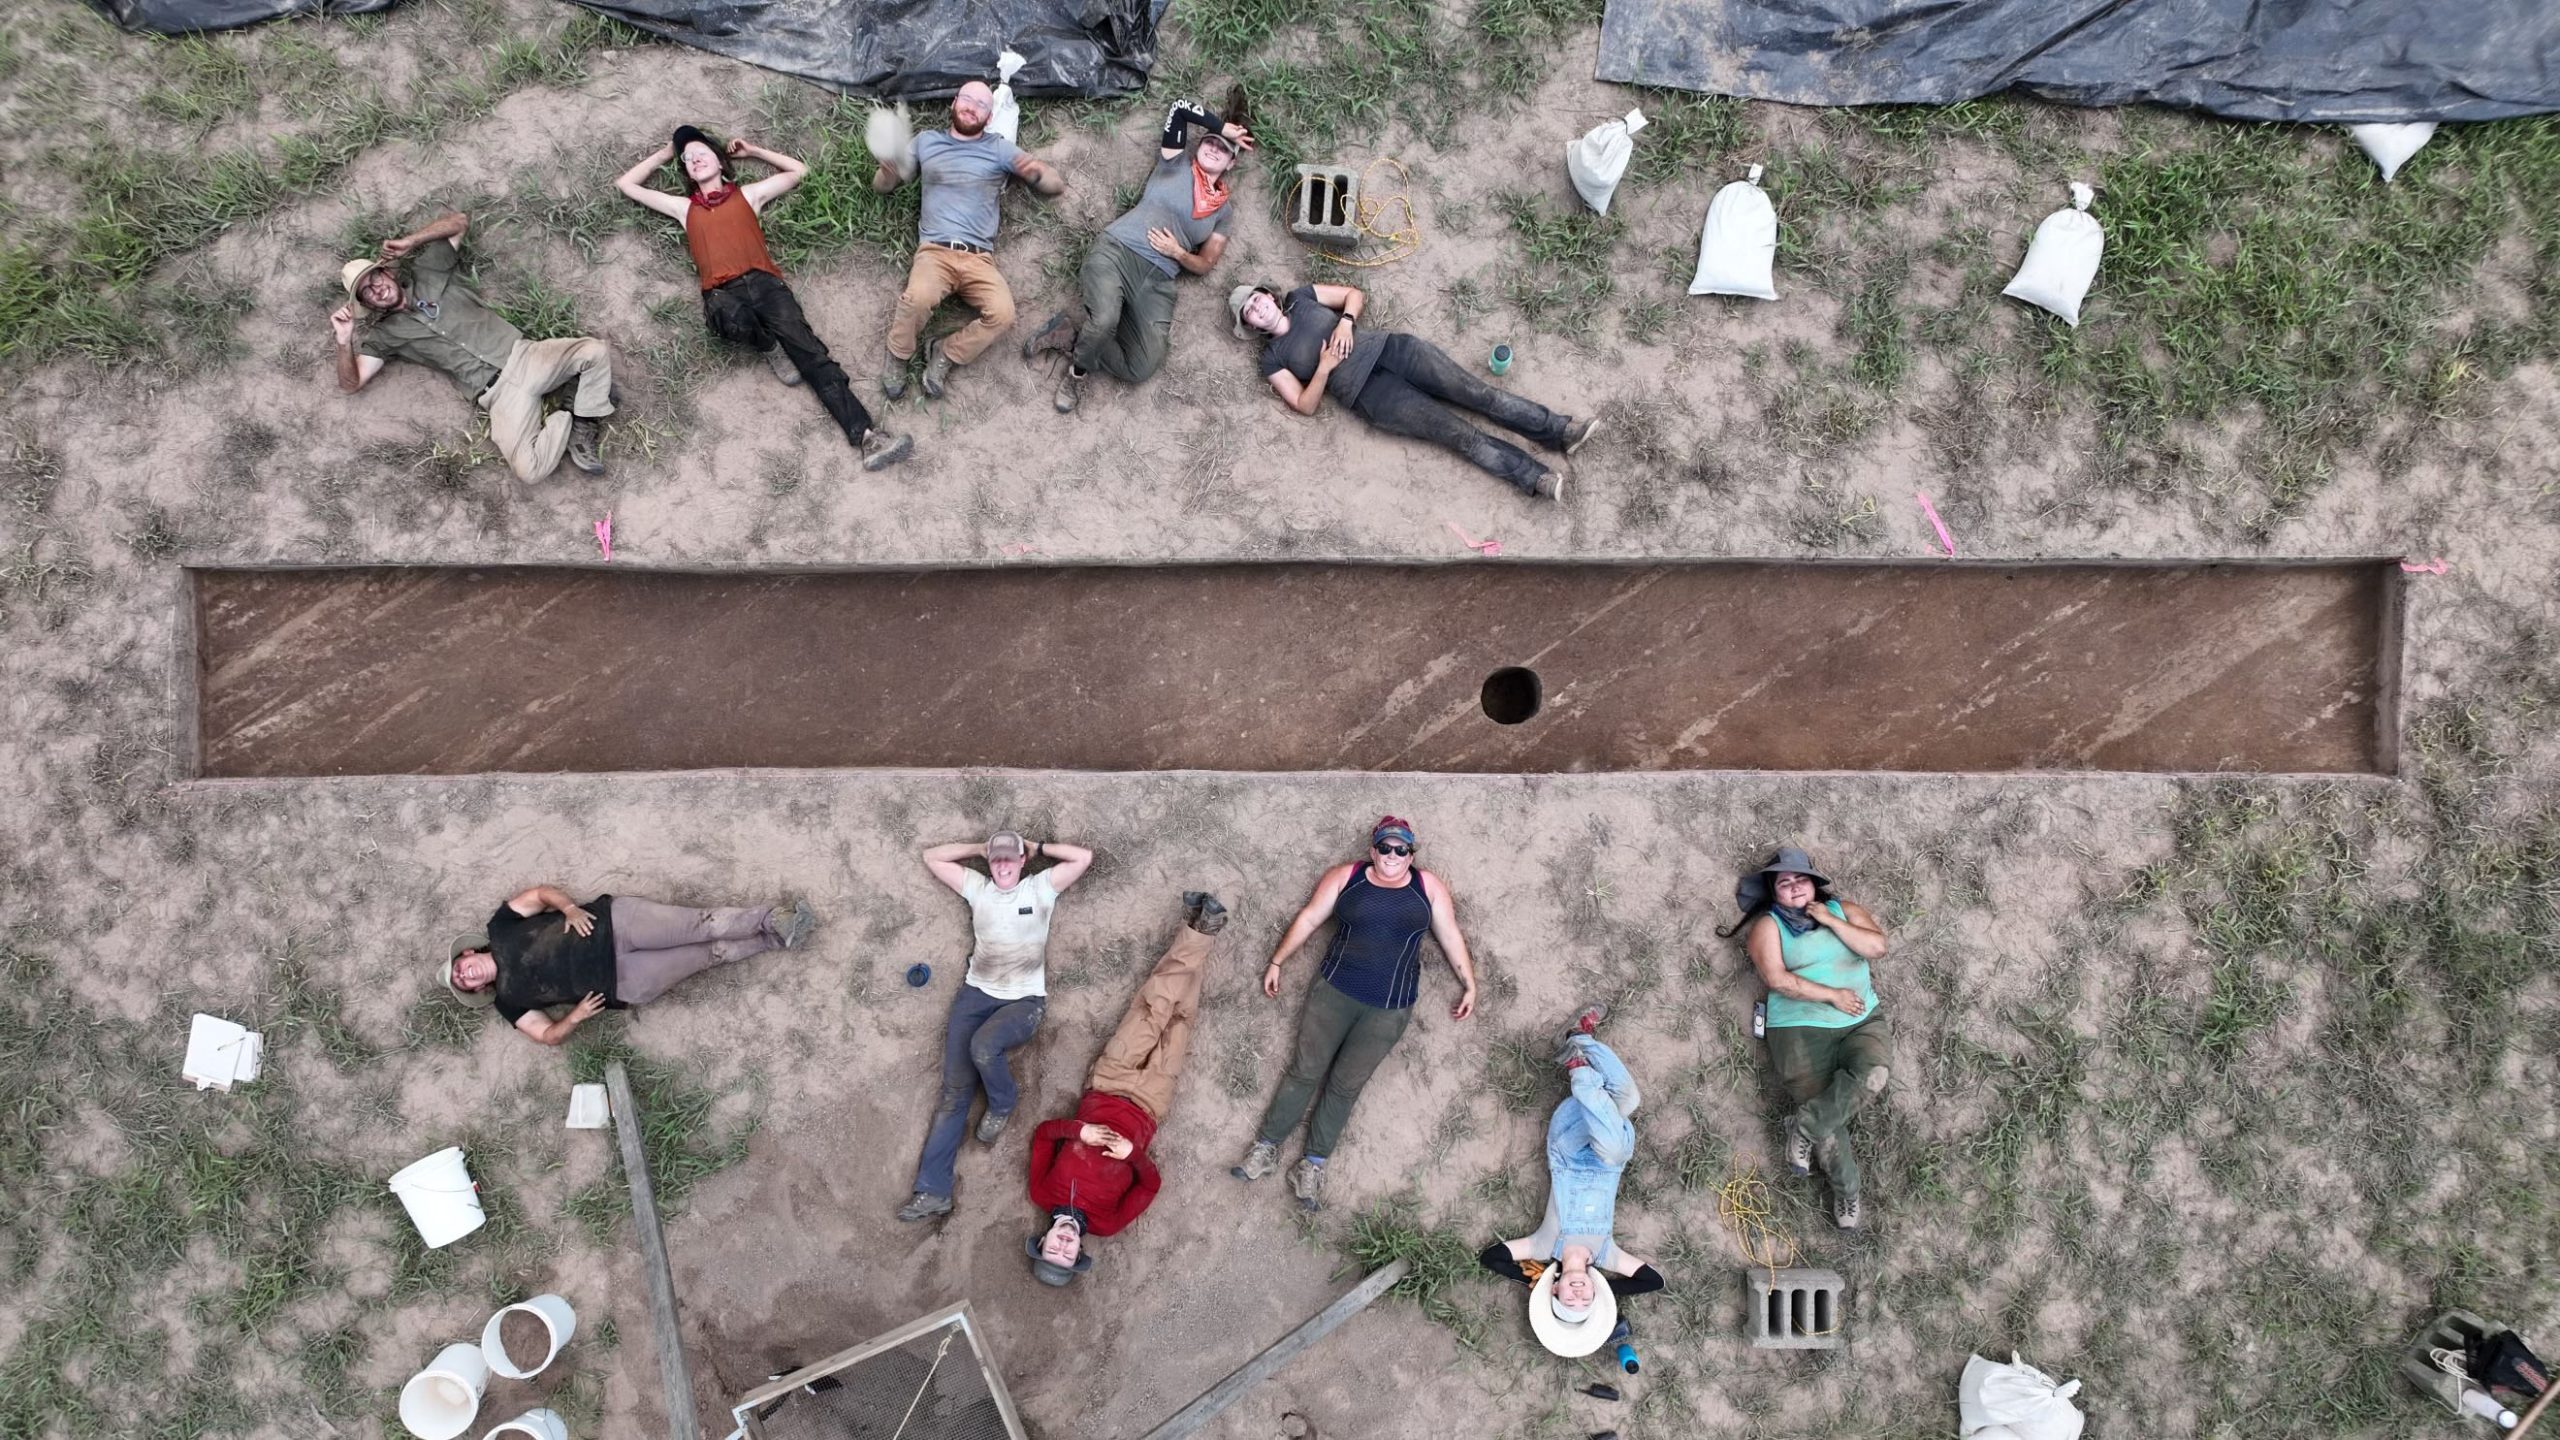
Breaking Ground and Gender Norms
Penn senior Qi Liu examines the shift in the field of archaeology from a male-dominated discipline to one where women are in the majority.
May. 28, 2024
By Jasmine Wang, Mac McKillip, Sarah Hinkel
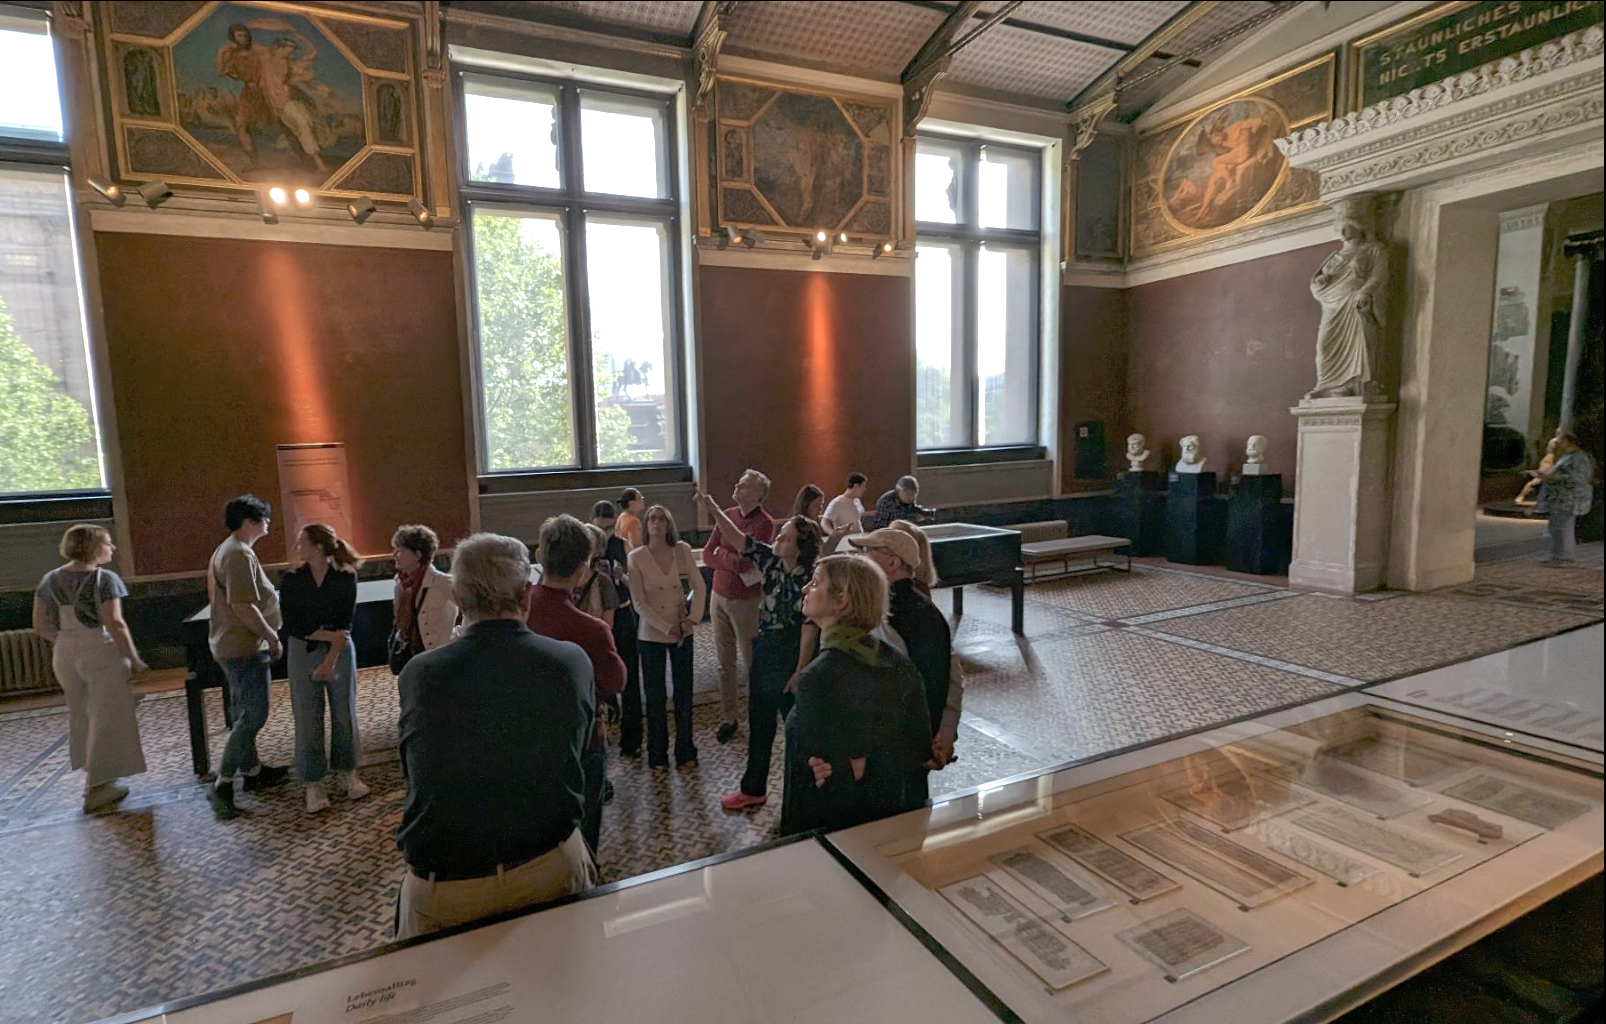
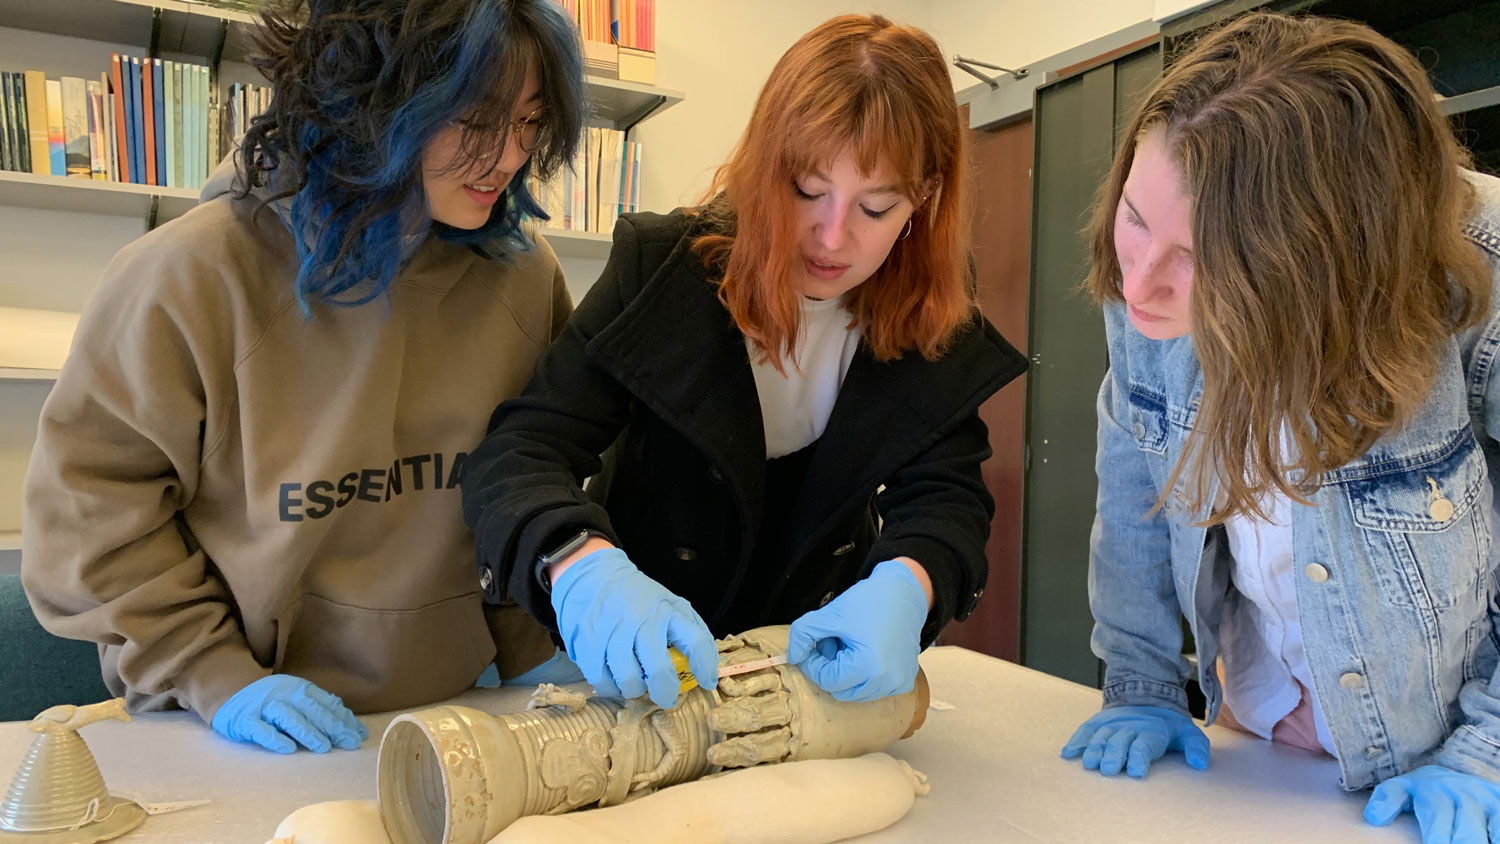
Fengshui for the Afterlife
Penn student curators learn about the making of a museum exhibition by exploring the contents of a 12th-century Chinese tomb in context with fengshui and cosmology.
May. 14, 2024
By Expedition Magazine Digital Extra
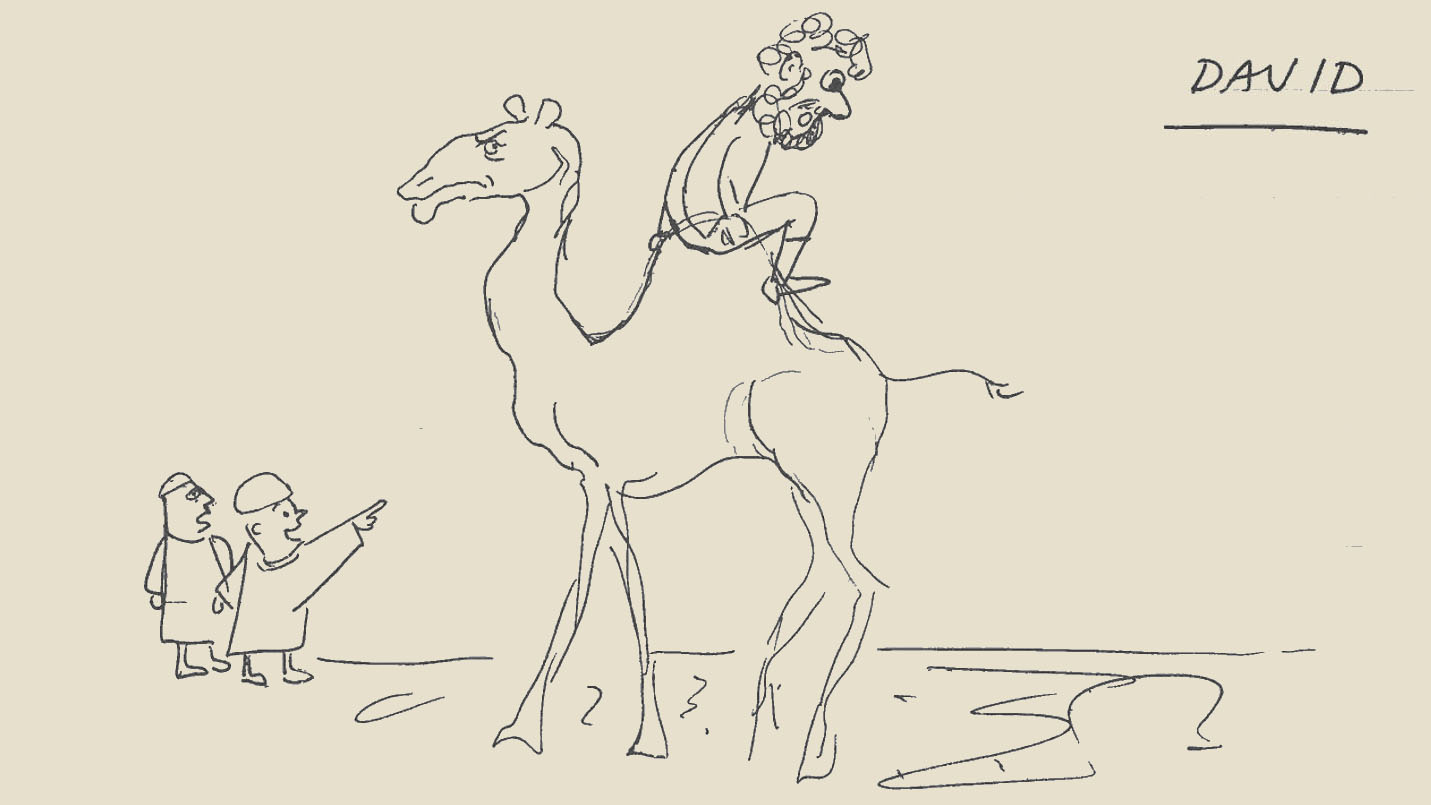
From Egypt, With Love
David O’Connor’s arrival to the Penn Museum in 1964 ushered in a new era of Egyptology in Philadelphia and beyond. But the famed archaeologist was also a dad—connecting with his young daughter across continents with these whimsical doodles.

Apr. 30, 2024
By Sarah Lavin
Preserving Buddhist Murals
It’s been nearly a decade since visitors could see the Penn Museum’s Buddhist Murals. Conservators are working to bring them back into view.